
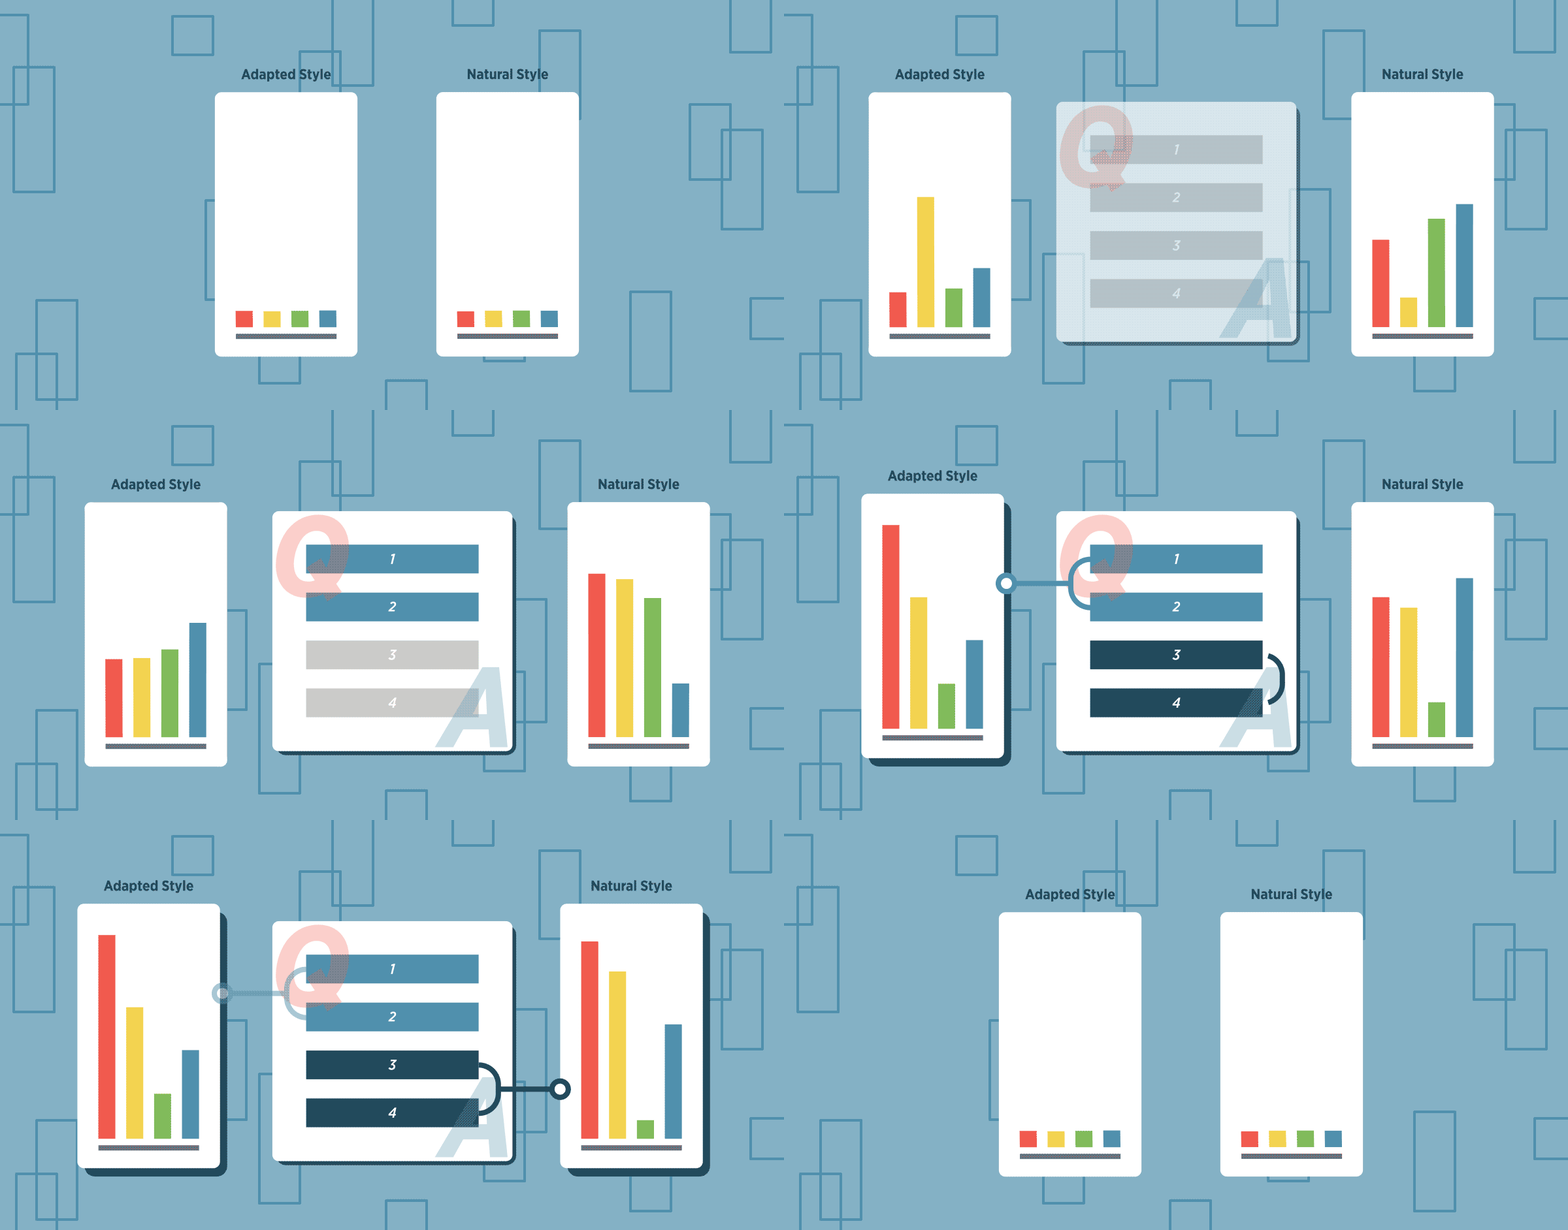
When you take a DISC assessment from TTI, you will see your results displayed in two different graphs. These graphs, the Natural DISC graph and Adapted DISC graph, provide crucial differences. If you only look at a single averaged DISC graph, you’re not getting the full picture of the assessment taker’s behavior.
Key Takeaways
- Natural vs. Adapted DISC graphs show how a person naturally behaves vs. how they adapt to their environment.
- The Natural DISC graph reflects instinctive, authentic behavior, while the Adapted DISC graph reflects situational behavior.
- Using two DISC graphs provides a more accurate and complete picture than a single averaged DISC profile.
- TTI’s DISC assessment captures both acceptance and rejection responses, improving behavioral accuracy.
- Understanding both graphs helps improve hiring, communication, team dynamics, and leadership decisions.
- Comparing Natural and Adapted behavior reveals stress, role misalignment, and development opportunities.
What Does Natural & Adapted Mean?
The Natural Graph shows an individual’s natural behavior, or how they prefer to do what they do. This score is on the right in TTI’s DISC assessments.
The Adapted Graph shows how an individual adapts their behavior to fit the situation they are in. This score is on the left in TTI’s DISC assessments.
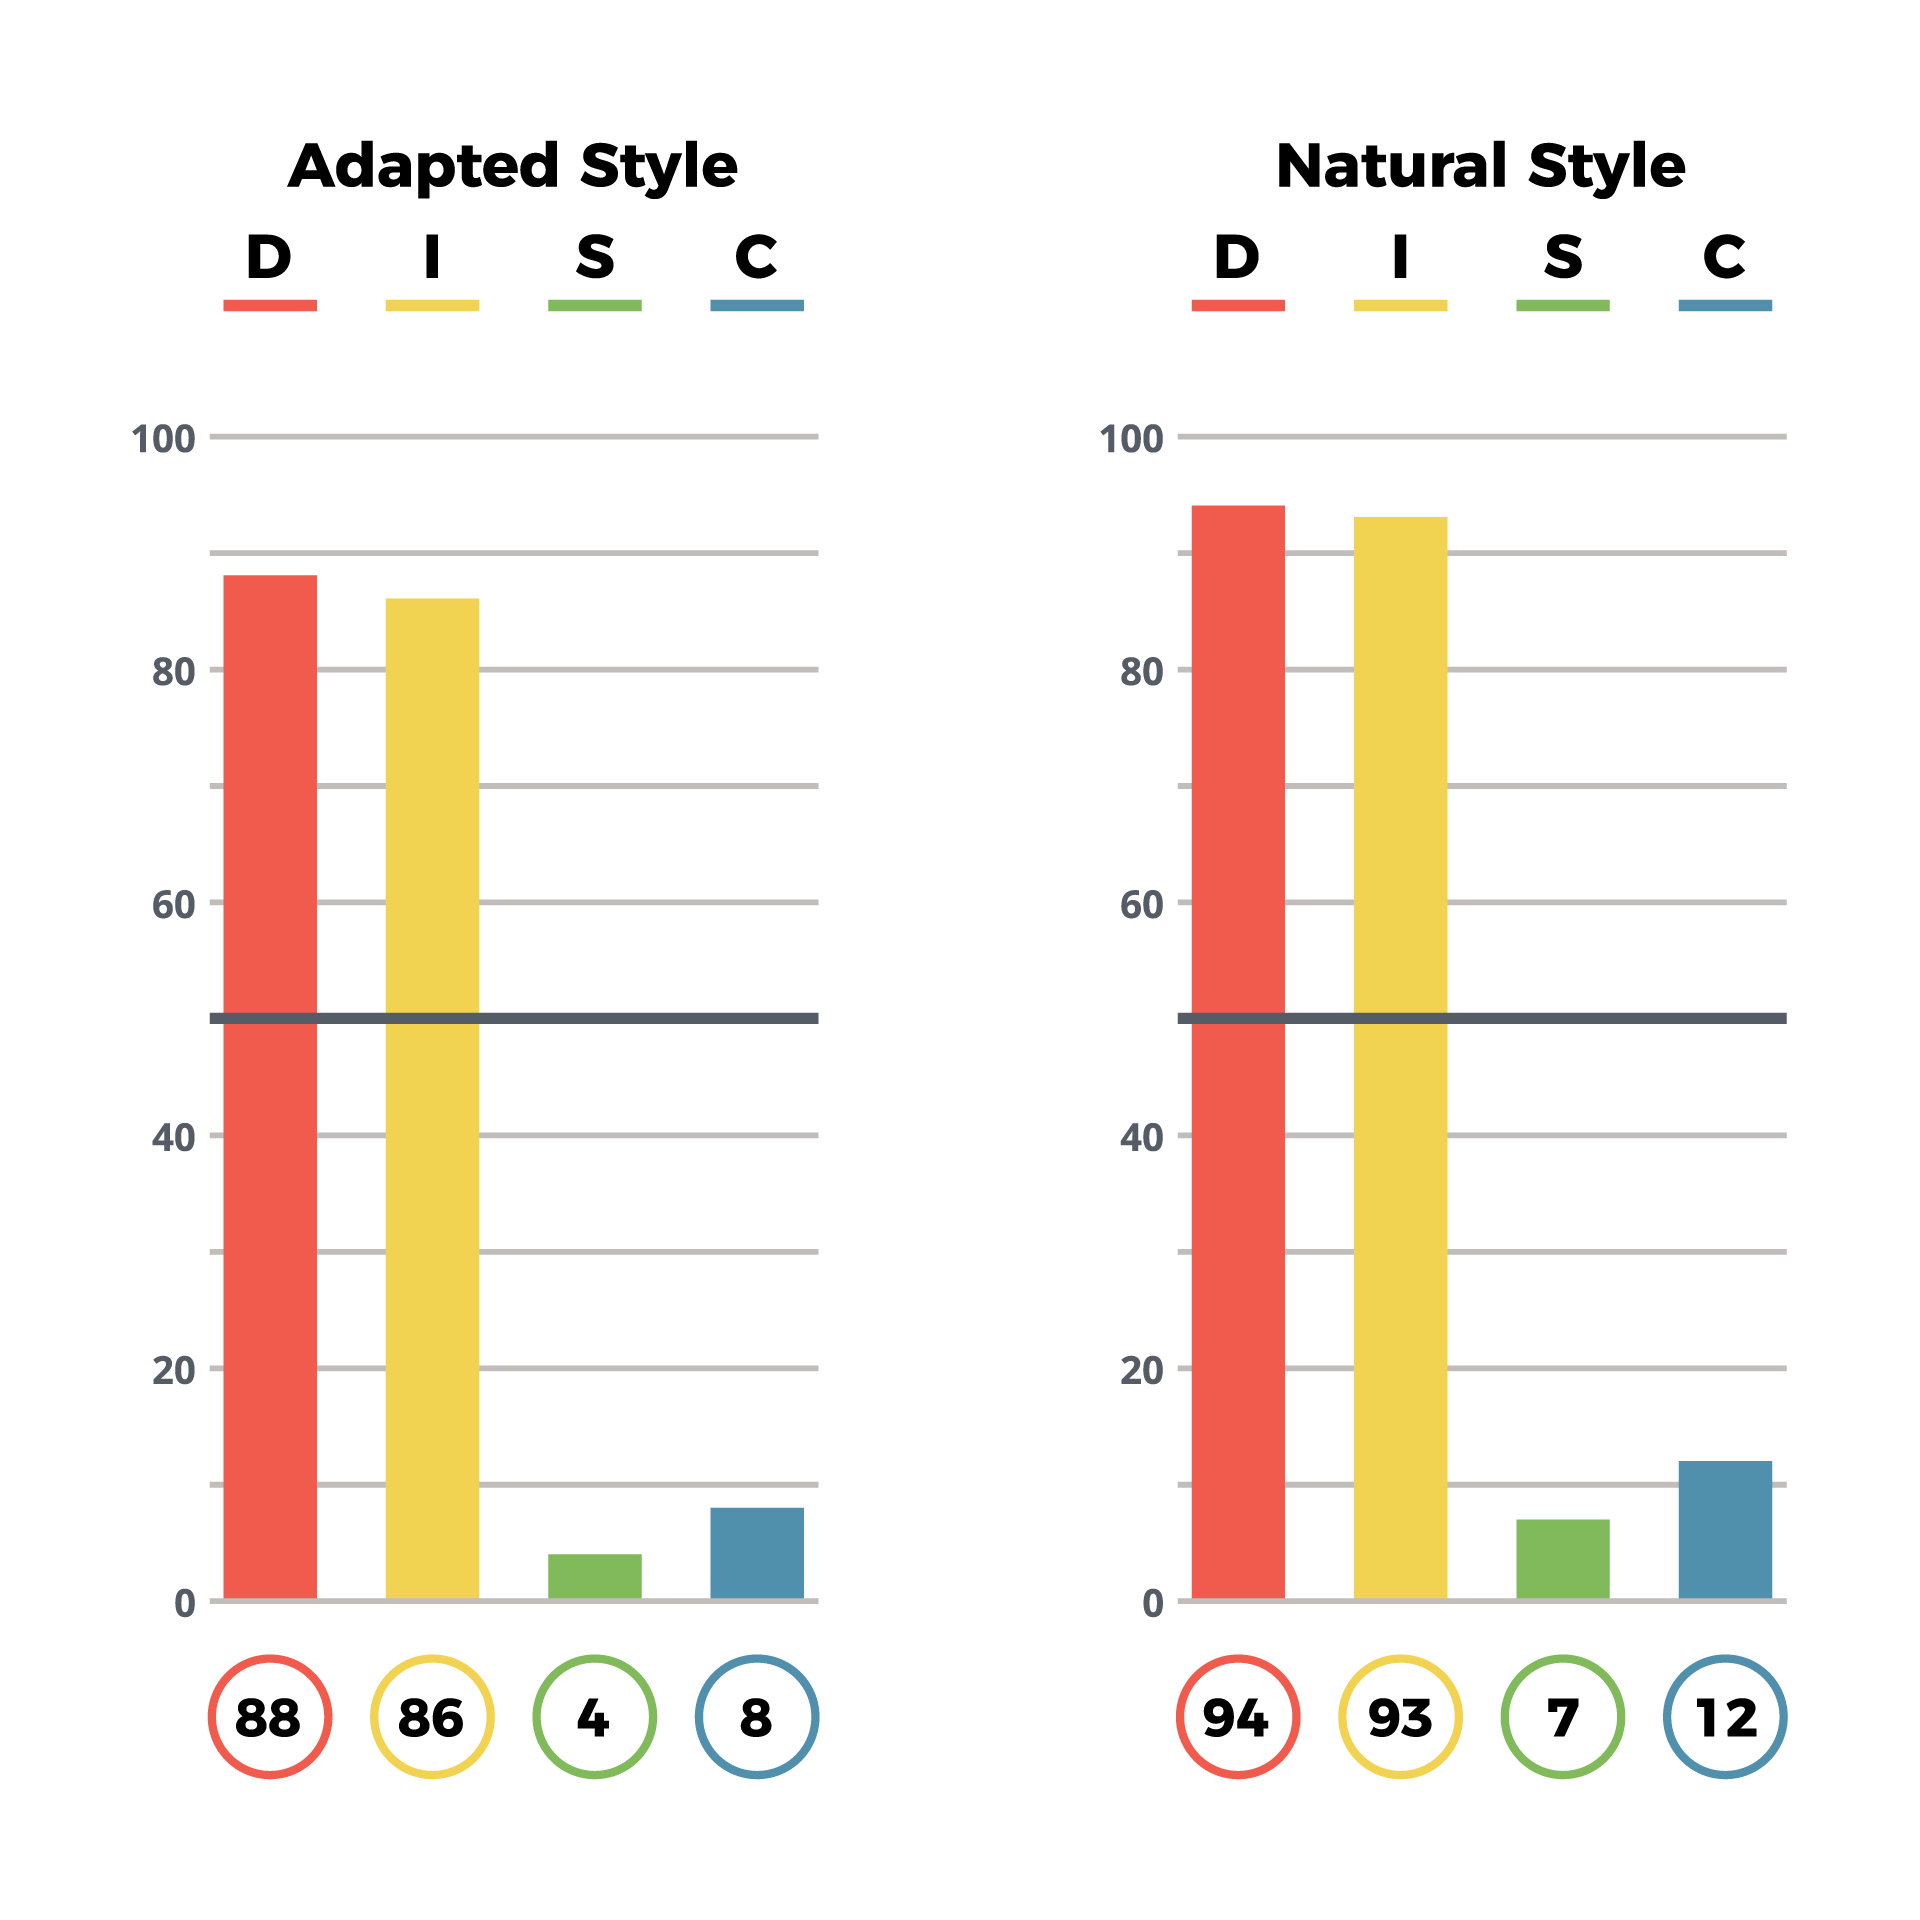 The Adapted Graph shows how an individual adapts their behavior to fit the situation they are in. This score is shown to the left in DISC assessments.
How Does TTI’s DISC Assessment Score Answer & Sort Data?
Our DISC questionnaire contains 96 adjective answers, which are measured in 24 blocks of four response items.
Each of these is aligned with D (Dominance), I (Influence), S (Steadiness), or C (Compliance). The assessment taker ranks these four choices from ‘most like me’ to ‘least like me’. This division between how someone ranks these scores creates both the Natural DISC graph and the Adapted DISC graph.
For more details on this scoring methodology, check out our White Paper.
Why Does Having Two Graphs Matter?
Why Do Two DISC Graphs Matter?
The most important benefit of having two DISC graphs is that it captures both acceptance and rejection responses when answering assessment questions.
To quote Dr. Ron Bonnstetter’s White Paper:
“Simply put, DISC behaviors cannot accurately be described using one graph when in fact each of us make decisions that are based on an initial, precognitive, neurological asymmetry that draws upon totally different brain processing of acceptance and rejection. Forced-choice data in a single graph, is analogous to comparing apples and oranges as one thing.”
How Can This Information Help You?

The Natural and Adapted DISC graphs are essential for understanding an individual’s behavioral style. By comparing how someone naturally behaves with how they adapt in specific situations, like a job outside their comfort zone, you can make better decisions.
These insights help you:
- Improve hiring decisions
- Build targeted development plans
- Align job roles and responsibilities
- Reduce workplace conflict
- Increase team effectiveness
If all of this data were combined into a single DISC graph, critical nuance would be lost. The true patterns of behavior would be diluted, leading to miscommunication, poor role fit, and reduced performance.
The Natural and Adapted graphs help you understand who someone really is and how they can adapt when needed, leading to more informed, strategic decisions in the workplace.
If you’re ready to learn more about DISC assessments, we have the resources you need:
- DISC: What You Need to Know
- Normal, Moderate, Extreme: Each DISC Type Under Pressure
- How to Adapt During Crisis by DISC Behavior
- How to Cheat on a DISC Test
- Natural Versus Adapted DISC Graphs
There’s a reason why DISC is one of the most widely used behavioral assessments in the world. The insights it provides are immediately applicable in the workplace and beyond. Understanding Natural vs. Adapted behavior can transform how you lead, communicate, and develop people.
Ready to apply DISC in your organization? Get started now!